
Load testing is a type of testing intended to determine the responsiveness, reliability, throughput, and scalability of an application. Apache JMeter is an open source application originally designed to test web applications but has evolved to work with many server and protocol types. This post is not intended as a complete introduction to JMeter, rather it assumes that you are familiar with the basic concepts found in the online documentation. You should at least have read Elements of a Test Plan from the user manual to gain full advantage of this article. What I found the documentation lacks, is more concrete examples and recipes applicable to real world use cases. This post is a collection of recipes I found useful in practice from various sources or by experimenting with the tool myself.
Automate Test Script Creation
Creating and maintaining test scripts is probably the most time-consuming part of your load testing process. The most flexible way is to manually add and configure individual elements through JMeter GUI but you also have several options to record your actions and generate a test plan from those automatically.
Using HTTP(S) Test Script Recorder
JMeter has a built-in HTTP server recorder that works by acting as a proxy and records actions you do in your browser. There is an official tutorial for this element which I recommend you read.
There is a problem in the tutorial with the URL Patterns to Include field: they set it to*\.htmlwhich is wrong. You need to use.*\.htmlotherwise you most likely won’t record anything unless your url looks something likeA.html.
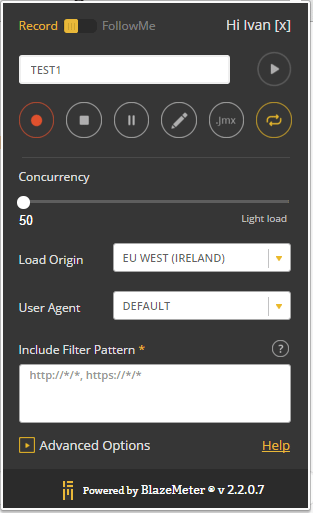
Using BlazeMeter Browser Plug-in
If you don’t want to bother with proxy settings, an easy way is to use a browser extension that supports recording your actions and exporting the data in JMeter format. I tried BlazeMeter extension for Chrome. It was very easy to work with and it did exactly what I needed. You just need to install the extension, start recording and click the Export to JMeter button and that’s it. This is how BlazeMeter GUI looked like when I installed it:
Various Request Types
JMeter can do far more than just opening web pages for you. Here you can find information on how to test applications that require you to write diverse request types.
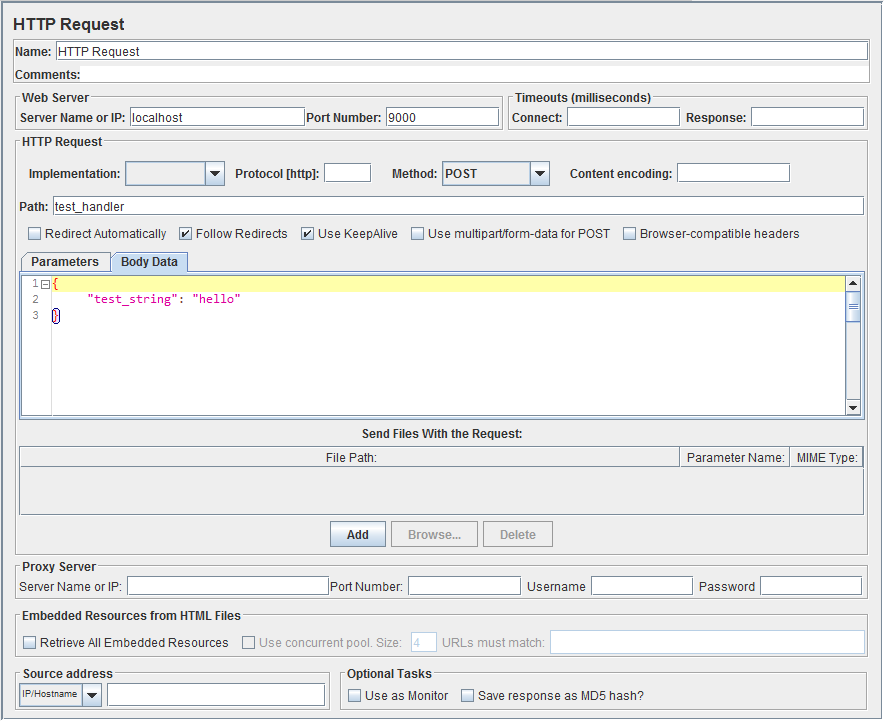
Testing REST Services
Since REST is nothing more than an architectural style that uses HTTP requests, we can still use the HTTP Request element to simulate such requests.
- Add a Thread Group element (Test Plan -> Add -> Threads (Users) -> Thread Group)
- If your service supports JSON data, add a HTTP Header Manager element (Thread Group -> Add -> Config Element -> HTTP Header Manager).Add the following attribute: Name: Content-Type Value: application/json
- Finally, add an HTTP Request element (Thread Group -> Add -> Sampler -> HTTP Request).Here you can configure server IP, path, your HTTP method (GET, POST, PUT, DELETE) and add your request data to Body Data field.
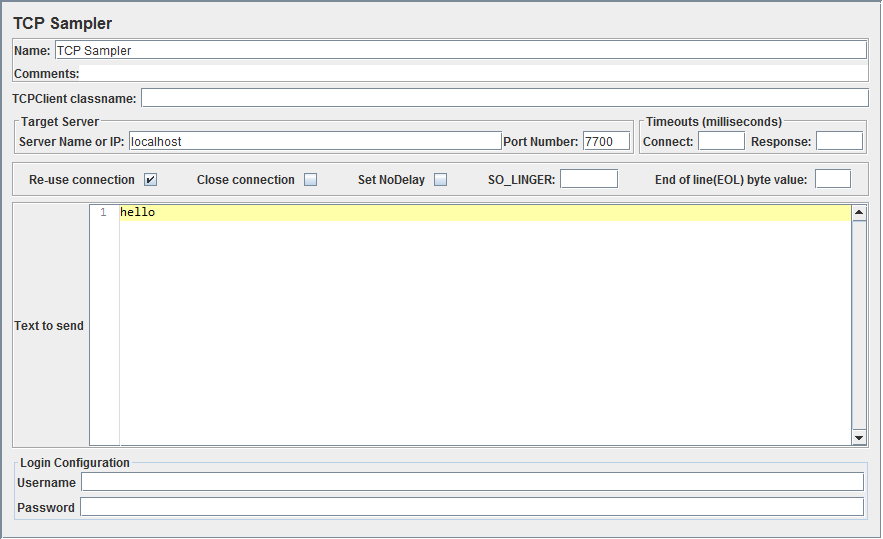
Testing TCP Servers
Opening a TCP connection and sending data works similarly to the HTTP testing workflow, just instead of HTTP Request use the TCP Sampler element.
You can use the Text to send field to specify the string you want to send.
Obviously this method can only be used to send plain text messages, but TCP Samplercan easily be configured to send binary data too. The secret is in the TCPClient classname field. If left empty, the default client is TCPClientImpl. Here is a list of possible clients to pick:
- TCPClientImpl – This implementation is fairly basic. When reading the response, it reads until the end of line byte, if this is defined by setting the property
tcp.eolByte, otherwise until the end of the input stream. You can control charset encoding by settingtcp.charset, which defaults to Platform default encoding. - BinaryTCPClientImpl – This implementation converts text you entered in GUI, which must be a hex-encoded string, into binary, and performs the reverse when reading the response. When reading the response, it reads until the end of message byte, if this is defined by setting the property
tcp.BinaryTCPClient.eomByte, otherwise until the end of the input stream. - LengthPrefixedBinaryTCPClientImpl – This implementation extends BinaryTCPClientImpl by prefixing the binary message data with a binary length byte. The length prefix defaults to 2 bytes. This can be changed by setting the property
tcp.binarylength.prefix.length.
So, in order to send binary data we need to encode it to a hex string and use BinaryTCPClientImpl or LengthPrefixedBinaryTCPClientImpl client depending on whether you want your message to be prefixed with length. This should be trivial to do using any hex editor. On Linux (or cygwin on Windows) you can use:
hexdump -v -e '/1 "%02x"' file.bin
- Add a Thread Group element (Test Plan -> Add -> Threads (Users) -> Thread Group)
- Add a HTTP Header Manager element (Thread Group -> Add -> Config Element -> HTTP Header Manager).Add the following attribute: Name: Content-Type Value: application/x-protobuf
- Add an HTTP Request element (Thread Group -> Add -> Sampler -> HTTP Request).Here you can configure your server IP and path. Add your serialized request in Send Files With the Request: field.
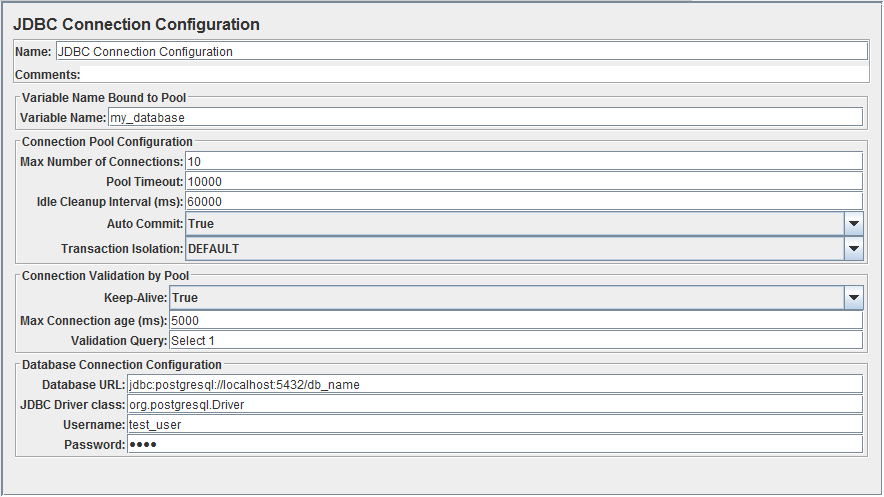
Testing SQL Databases
There may be times when it is more practical to test the database of your application directly in order to discover bottlenecks in your queries. I will show you how to connect to a PostgreSQL database but you can apply this to any database that supports JDBC API. First, you will need to download the JDBC driver JAR for your database. For PostgreSQL, you can get it from here: https://jdbc.postgresql.org/download.html. After you download the JAR, put it in lib folder inside your JMeter installation dir.
Be sure to restart JMeter after copying the driver class to the lib folder otherwise it will not be loaded.
- Add a Thread Group element (Test Plan -> Add -> Threads (Users) -> Thread Group).
- Add a JDBC Connection Configuration element (Test Plan -> Add -> Config Element -> JDBC Connection Configuration).For Variable Name field, use a name that you will later use with the JDBC Requestelement. I will use my_database in this example.In Database URL field, enter your database connection string. For a local PostgreSQL database, it will look something like this: jdbc:postgresql://localhost:5432/db_nameIn JDBC Driver class enter the java path to driver class. For PostgreSQL driver this is org.postgresql.Driver, refer to your JDBC driver documentation for other databases.Finally, enter username and password to the appropriate field.
- Add a JDBC Request element (Thread Group -> Add -> Sampler -> JDBC Request).For Variable Name field, use the same value you specified in JDBC Connection Configuration element. Using SQL Query fields, you can customize your query.
Limiting Request Frequency Using Timers
By default, JMeter thread pool works by sending new requests instantly as soon as the previous request is completed. This may be desired in situations when you are trying to stress test your application as much as possible but may not be realistic for a lot of applications. If clients are real users, there will be gaps between requests often referred to as “think time”. You can simulate this by using timer elements. You can add timers directly to Thread Group element or to a desired sampler element, depending on whether you want it to affect global or local scope. Timers that you will most commonly use are:
- Constant Timer (Add -> Timer -> Constant Timer). This is the simplest one, it has a property with milliseconds sleep between requests. You don’t want to use this one to simulate human requests as it is not realistic.
- Gaussian Random Timer (Add -> Timer -> Gaussian Random Timer). Useful if you want to simulate something like “sleep around 300ms”. As the name says, it uses gaussian distribution.
- Constant Throughput Timer (Add -> Timer -> Constant Throughput Timer). This one is used if you want to limit your throughput rate to a fixed value, for example if you want your thread pool to issue 5 requests per minute. Useful for monitoring requests where you want to avoid a noticeable impact on the main test workflow.
Adding Logic to Your Tests
More often than not, you will need to add some logic and control flow to your test plan execution. For those purposes, you need to use Logic Controller elements. Here you will find familiarly named elements like:
- Loop Controller
- Only Once Controller
- Random Controller
- If Controller
- While Controller
- ForEach Controller, and some others.
I found the official documentation for logic controllers to be quite good, often with examples, so I highly recommend to check it out if you have such need for your test plans.
Reading Data from CSV Files
Let’s say you want to test the application that requires signing up or you have a path with many different parameters and it is not practical to add a new element for each of these data sets. A better way would be to organize your data into a CSV file and use the CSV Data Set Config element. It works by reading line by line for each thread and populating variables specified by the header row. You can reference the variables by using ${variable_name} syntax in your elements. Let’s say you want to test an application on URL http://www.foo.com/products/${category_id}/${product_id}. This is how your CSV file would look like:
category_id,product_id
10,1
10,2
11,4
The URLs we want to test are: http://www.foo.com/products/10/1,http://www.foo.com/products/10/2 and http://www.foo.com/products/11/4.
- Add a Thread Group element (Test Plan -> Add -> Threads (Users) -> Thread Group).
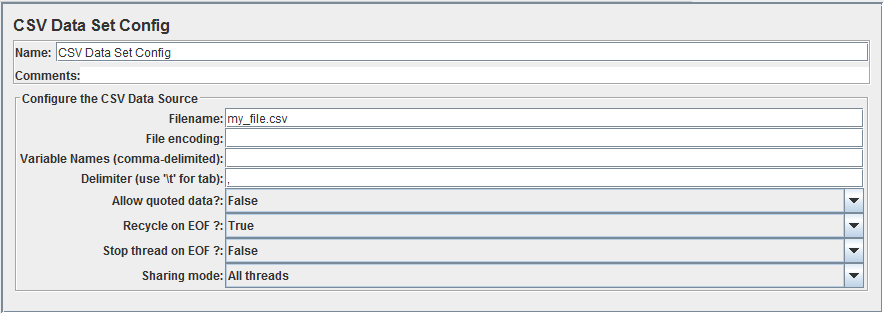
- Add a CSV Data Set Config element (Test Plan -> Add -> Config Element -> CSV Data Set Config). Fill Filename field to match your CSV filename. You can leave the rest of the fields as they are.
- Add an HTTP Request element (Thread Group -> Add -> Sampler -> HTTP Request). For Path write http://www.foo.com/products/${category_id}/${product_id}
Parsing Response Data
Being able to parse response data from the request and extract important information into variables can be extremely powerful as you can use that input to feed new elements in your execution chain. This way you can create flexible and dynamic tests that react based on input from servers. JMeter has a rich set of elements capable of extracting values from different response formats.
EXTRACT VALUES USING REGULAR EXPRESSIONS
If you are familiar with regular expressions, you will be able to extract almost any value assuming you understand the structure of the response. If not, I recommend to read more about the topic, there is a ton of material online. Suppose you have a service that returns to you a string like this:
First name: John, Last name: Smith
And you want to extract full name from it (John Smith in this case). You can then use the full name to pass to another request, for example.
- Add a Thread Group element (Test Plan -> Add -> Threads (Users) -> Thread Group).
- Add an HTTP Request element (Thread Group -> Add -> Sampler -> HTTP Request). Configure it to target the desired service or check Testing REST services section.
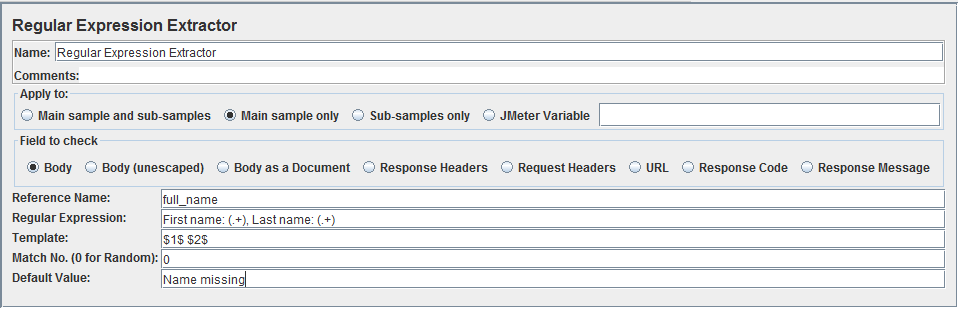
- Add an Regular Expression Extractor element (HTTP Request -> Add -> Post Processors -> Regular Expression Extractor).In Reference name, enter the variable name of the extracted value. You can reference it in other elements with
${variable_name}. In Regular expression enter:First name: (.+), Last name: (.+)In Template:$1$ $2$Template is used to compose final value from regex. Place holders in form$x$represent index of regex group at positionx.
Parsing response body data is just one way of using Regular Expression Extractor. You can also configure it to parse data from response headers or Response code by using Field to check radio button group in the element configuration GUI.
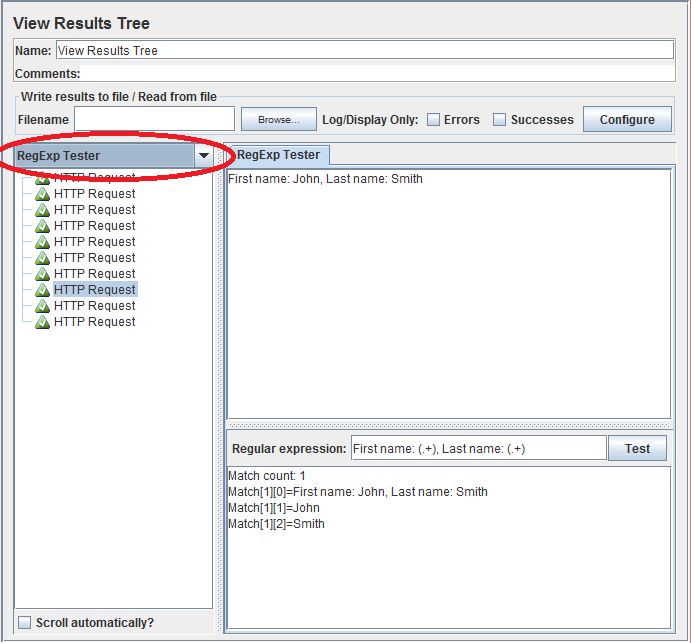
A handy component for debugging your regular expression is View Results Tree element. This component can be used to debug various response info. Add it to the Http Requestelement (HTTP Request -> Add -> Listener -> View Results Tree). In the combo box to the left, pick RegExp Tester to be able to test regular expressions and run your test to get some responses to work with. After you get you response, select it from the list and use Regular expression field to test your desired regex. This can be a huge time saver as you only have to run your test once to collect some results and you can test on your actual data until you are satisfied.
Beside using raw regex to parse response data, JMeter supports a few more specialized techniques that can make your life easier depending on your needs. Since they are all very similar to Regular Expression Extractor, they will not be explained individually. I encourage you to consult component reference in the official documentation. I will name a few of the popular response formats and specify the most suitable element for the job:
| Format | Element |
|---|---|
| XML | XPath Extractor |
| JSON | JSON Path Extractor |
| HTML | CSS/JQuery Extractor |
| Other | Regular Expression Extractor |
Monitoring Test Results
There is not much value in spending time to build a perfect test without metrics that help you view and analyse the results. JMeter comes with some elements that can be used for many needs, especially during the debugging phase of your test building process. You should add listeners by adding them to the Thread Group element if you want it to affect every sampler, or add it to a specific sampler. I will mention a few that stand out.
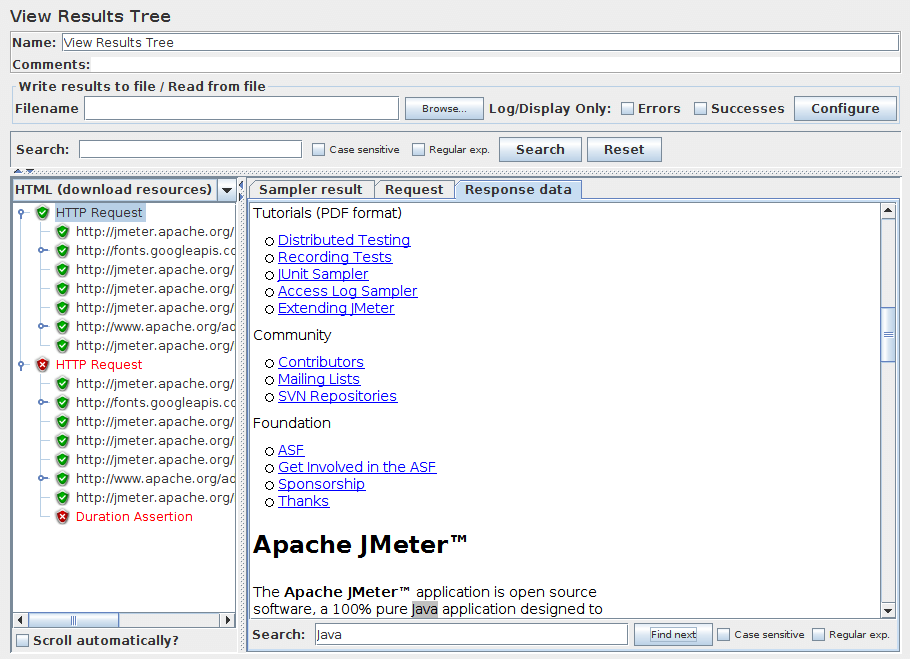
View Results Tree (Add -> Listener -> View Results Tree)
You should use this element during your debug phase only as it records as many details as possible about every request, which makes it extremely useful for debugging, but it has a huge performance impact during load testing.
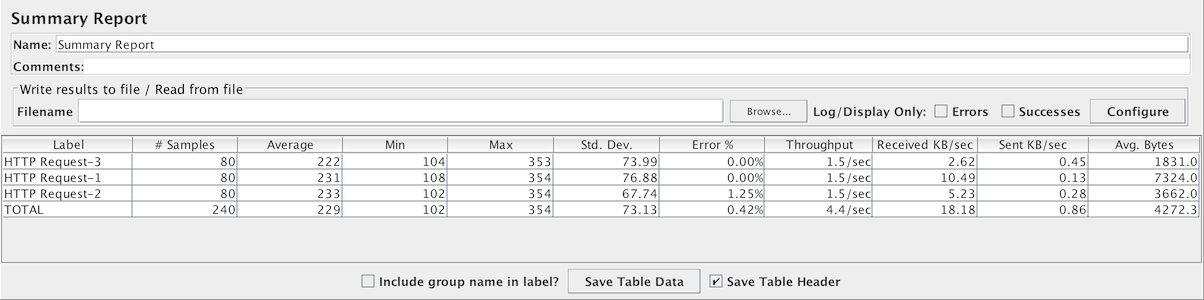
Summary Report (Add -> Listener -> Summary Report)
This element maintains a table with a row for each differently named request in your test. Following details are available:
- Label – The label of the sample. If “Include group name in label?” is selected, then the name of the thread group is added as a prefix. This allows identical labels from different thread groups to be collated separately if required.
- # Samples – The number of samples with the same label
- Average – The average elapsed time of a set of results
- Min – The lowest elapsed time for the samples with the same label
- Max – The longest elapsed time for the samples with the same label
- Std. Dev. – the Standard Deviation of the sample elapsed time
- Error % – Percentage of requests with errors
- Throughput – the Throughput is measured in requests per second/minute/hour. The time unit is chosen so that the displayed rate is at least 1.0. When the throughput is saved to a CSV file, it is expressed in requests/second, i.e. 30.0 requests/minute is saved as 0.5.
- Kb/sec – The throughput measured in Kilobytes per second
- Avg. Bytes – average size of the sample response in bytes.
There is an excellent set of plugins available on http://jmeter-plugins.org/. Listener elements from this plugin are a must if you need any level of advanced visualization features for your results. I recommend that you play with them yourself as I will link only a few of them here so you get an idea what is possible to do:
- Response Times Distribution – View response times distribution
- Response Times Over Time – View a graph of response times over time
- Transactions per Second – View a graph of completed requests count over time
- Page Data Extractor – Plot a custom value parsed from response. This is very useful if you have application specific monitoring information published on some URL (for example, current size of a server request queue). Make sure to use a separate thread pool for this listener with 1 thread and limited throughput as you do not want to spam your monitoring handler and impact performance of your main test!
Next Steps
What I have shown here are the most common and basic use cases that should satisfy most of your everyday load testing needs. However, you will have to go far beneath the surface as your needs grow stronger. Here are some links that can take you in the right direction and are necessary if you need to exploit the full power of JMeter:
- JMeter Tutorial – It is very easy to write new custom JMeter elements. This tutorial is meant to get you started quickly.
- JMeter Distributed Testing Step by Step – You will quickly find that often one machine is not enough to generate enough load to saturate your new super scalable application. JMeter supports coordinating distributed tests and collecting results in a master node very easily.
- Best Practices – A page with best practices so you can get the most out of your tests.