
A/B testing has been playing a very important role in the gaming industry in the past years, ever since the free to play model gained an edge. It has been the go to method when unsure about the potential and value of a new or redesigned game feature. Moreover, A/B testing is very prominent in other areas too — commercial websites and social networks to name a few.
What is A/B testing?
It’s basically statistical testing applied in practice — nothing more than that. The key word here is applied. Most of the art in performing a proper A/B test lies in its perfect implementation, and, as we will cover later in this article, it’s not as easy as it sounds. Actually, that’s what this article is all about – doing some clever tricks and methods to make A/B tests as powerful as they can be.
Why is it important?
A/B tests are so popular because they resolve dilemmas in the best possible way — objectively. Implement an idea and try it, nothing gets better than that. If they’re done right, they help make very good objective decisions that may lead to making a better game that earns a lot more. That means everyone can be happy, right?
Who are the stakeholders and what are their interests?
The blessing and the curse of A/B testing is that many stakeholders find their interest in performing them.
Game designers believe that A/B tests are going to solve their dilemmas regarding game design — progression pacing tweaking on a live game, prices of new or redesigned items, UX decisions — there’s nothing an A/B test can’t tackle.
Marketeers want to optimize their campaigns; they would like to know what kind of effort brings the most value, the cheapest or best paying users. Business guys and PM’s are eager to improve revenue metrics. All of them like having powerful A/B tests in their arsenal.
How it’s usually done?
At the first glance, it’s a relatively simple process. It may be split into five phases:
- Place a hypothesis. This may include something as small as a game parameter tweak or as big as releasing a new feature only to a subset of users.
- Define metrics that will be used for evaluation. This should be a natural extension to the first phase as changes tend to be made with an end in mind, believing which KPIs might be improved.
- The test design should answer the question “to whom and for how long?”. The longer the test duration and the bigger the groups, the more powerful the test, but bigger the risk. The “to whom” part becomes tricky in an online PVP setting, and it will be the focus of this article.
- Release the test. It could last from hours to weeks, depending on factors such as group sizes and desired sensitivity.
- Analyze the results using statistical techniques in order to make a decision as to which group is the best performer.
It’s a very common process, so no need to discuss it further. Now, I’d like to move onto some practical challenges we faced whilst performing A/B testing.
Challenges
Statistical noise
Statistical noise is a well known enemy to data scientists. High variance game metrics are, by Murphy’s law, usually the ones we’re interested in the most. This makes our lives harder, and our sampling algorithms more important.
Fairness in online PVP
On the other hand, statistical noise is not something a large ensemble can’t solve. If you have a website with millions of visits every day, statistics will do their job and rule out the noise. In that setting, millions of users means millions of experimental units — each visitor is independent and may be assigned to a group without paying attention to what other users were given.
Unfortunately, if you’re a proud developer of an online PVP game, you have an extra worry to wake up with — fairness. Namely, your primary focus should be that people who compete against each other in an online PVP setting are exposed to the same conditions, particularly if it’s not the UX we’re talking about. A very engaged user would be furious to see that his opponent needs less training sessions in order to obtain the same training bonus in Top Eleven. He wouldn’t be very happy with unfair prices of Scout players, too.
Now, this notion of fairness naturally splits your player base, no matter how big, into smaller chunks. Let’s call them servers.
Server = {users that may possibly compete against each other in an online PVP setting}
A server may or may not be a physical server. It can be a game level, a country, some other segmenting property, or, indeed, a physical server. What this practically means is that we’re not operating with millions of experimental units anymore — we’re dealing with hundreds. That implies that we have to be very, very careful with our sampling algorithm if we don’t want our test groups to be very different even without exposing them to versions A and B.
Sampling Techniques
So, our task is to sample out of a population of servers, whose order of magnitude is in the hundreds, in such a way that our groups of servers are very similar before the test is released. For the purpose of an example (and with strong roots in reality), let’s say that we are looking at ARPDAU (Average Revenue Per Daily Active User) as the main metric.
Random and Stratified Random
We started with traditional random sampling, but it was obvious that with a population this small, it just wouldn’t work. The first idea to improve this was to try with some kind of stratified random sampling, where we split our servers into Low ARPDAU, Moderate ARPDAU and High ARPDAU, and sample from the three groups independently. As expected, it worked a bit better, but still, nowhere near satisfactory. We had to repeat this over and over, and visually inspect the similarity of obtained groups, which is very tedious and ill-advised.
Systematic Sampling
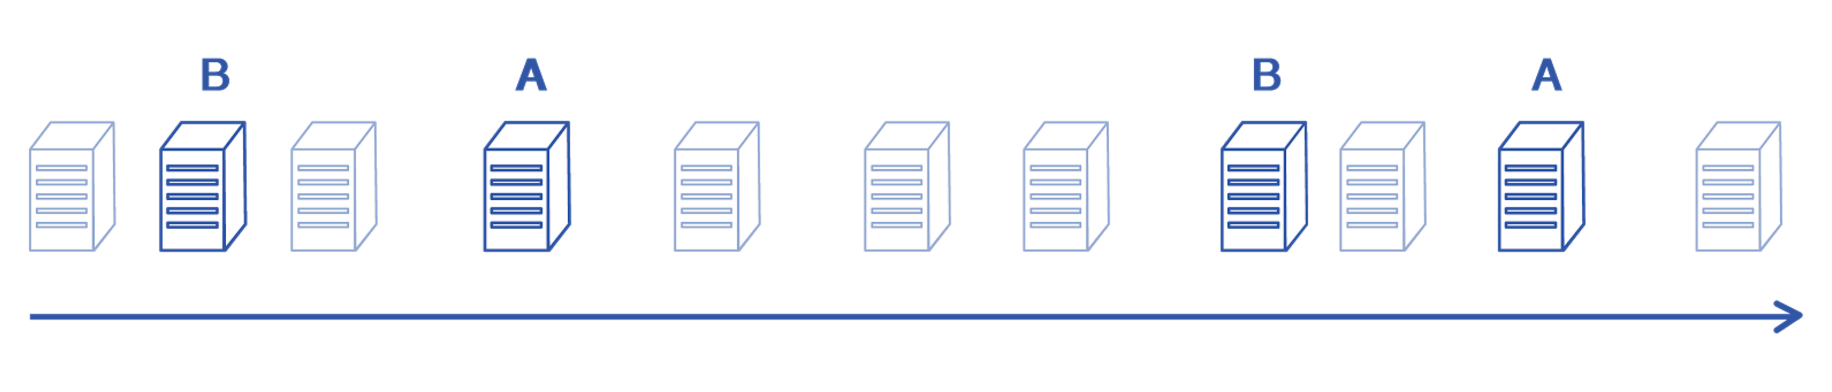
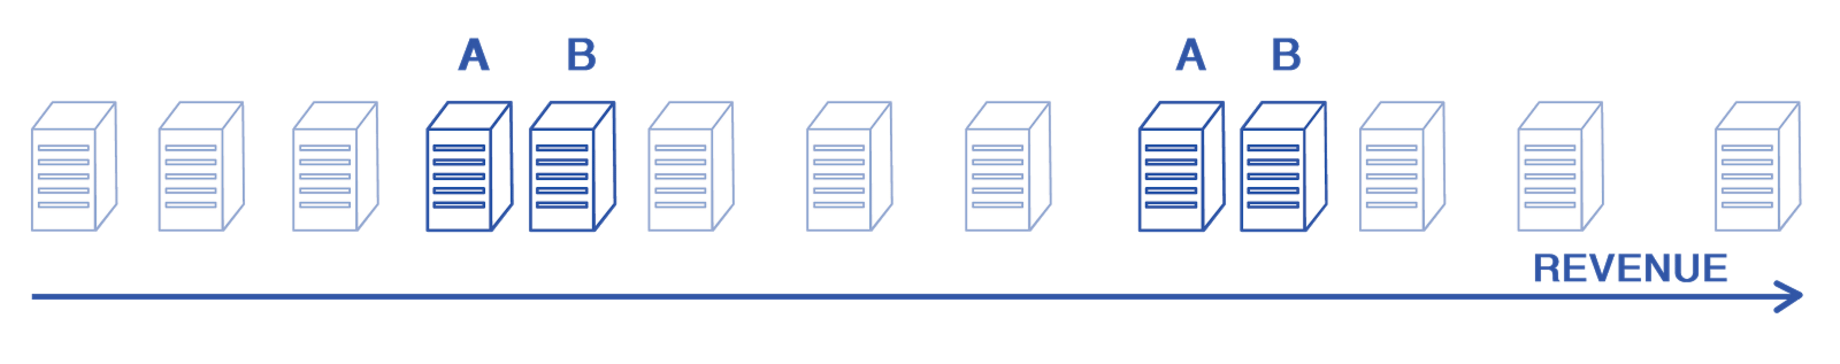
We moved on, searching for a better solution. Again, for the purpose of an example, let’s say that we wanted to sample two groups of ten servers to A/B test on. Our next idea was to sample couples of servers in the following way:
- Sample a server ‘s’ randomly and assign it to group A
- Pick a server most similar to the server ‘s’ and assign it to server B
- Repeat ten times.
So, this should work based on the observation that if all pairs are very similar to each other, two groups created this way should be very similar too. And it does work when we’re dealing with only one metric to track.
What happens if we want to track more than one output metric — say five of them (which is very realistic)? Due to the curse of dimensionality, it gets harder and harder to find pairs of very similar servers in a population of hundreds. We have to find a better way to cancel out these differences by sampling cleverly.
A novel approach – Optimal Sampling
So we did. The idea was to give up on just sampling and start optimizing. Why not make our groups as similar as possible? Literally! No random sampling — pick them optimally. We have the historical data at our disposal. For each output metric, each server, each day, we have the value and we can use this data to pick the groups with the minimal possible difference.
In other words, we can solve an optimization problem using a cost function that penalizes any misalignment between the groups. And we can find this optimal point using a very simple optimization algorithm.
The Algorithm
Defining the cost function
We defined the cost function in a — for those who are into machine learning — very natural, L2 fashion. We penalize the square difference between the groups for each metric and for each day of historical data. That way, and with the help of an optimization procedure, we try to find the optimal assignment of servers to groups.
We define the cost function in the following way:
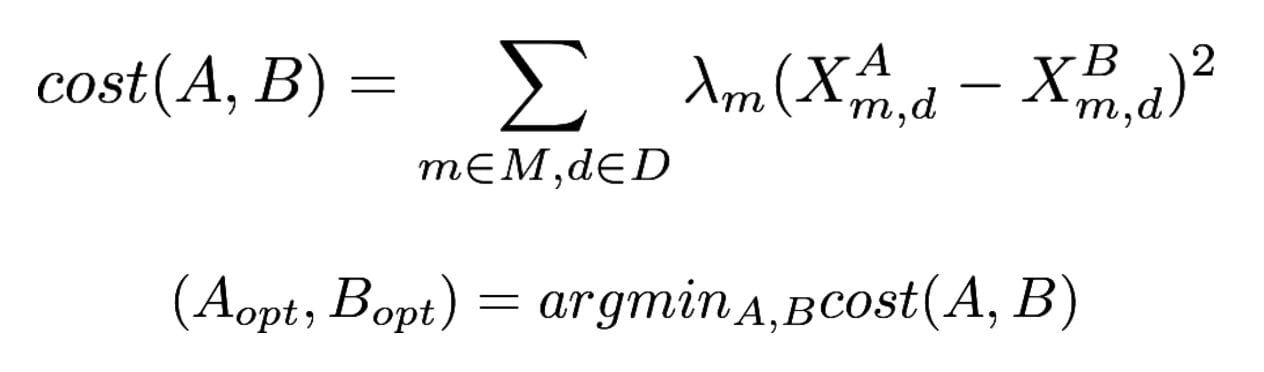
M is the set of all KPIs of interest, D is the set of all historic dates we optimize the groups on, lambdas are the importance weights used to address the importance of optimizing on each individual metric, and X’s are the actual values of the desired metrics on a given day.
Optimizing
The cost function can be minimized in many ways. I’ll present a very simple procedure first, and then will discuss some potential improvements on the idea.
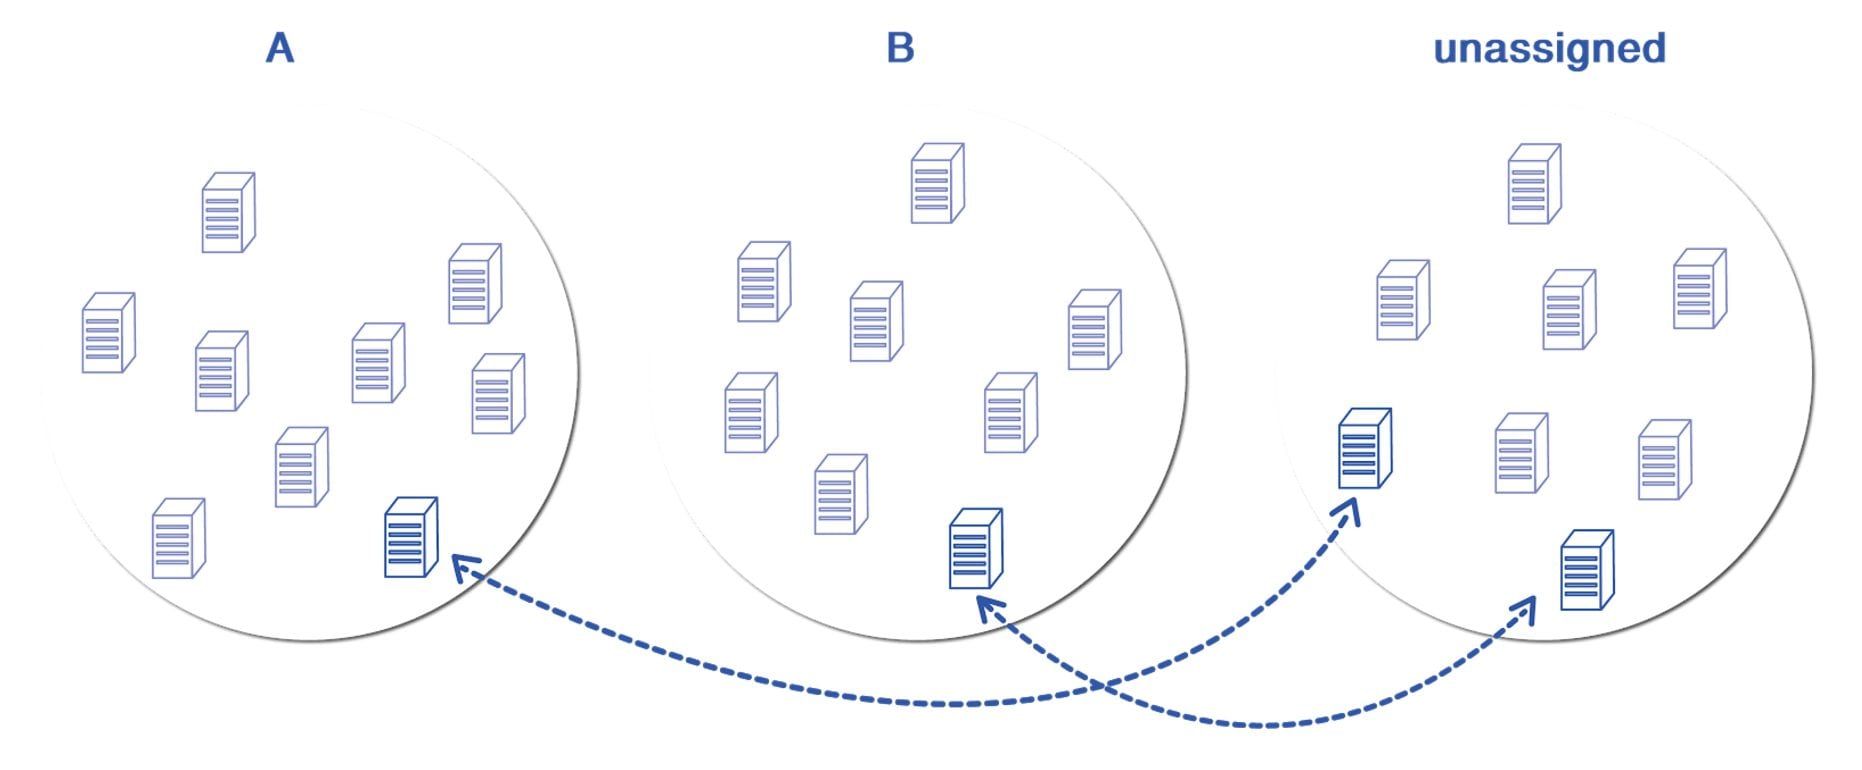
The greedy approach works as follows:
- Start with A, B and Unassigned server buckets randomly initialized
- Find a (A, Unassigned) or (B, Unassigned) server swap that maximally reduces the cost and perform that swap
- If there is no such swap, terminate and return (A, B). Otherwise, return to step 2
I presented a two group example here, but the procedure easily scales to more than two test groups. One iteration is graphically presented in the figure below:
Possible improvements to the optimization technique:
- Add (A, B) swaps: this doesn’t make the procedure less greedy, but could possibly speed up the convergence a bit.
- Add multi-server swaps: instead of swapping individual servers, swap tuples of servers. There is a trade-off between speed and optimality, and it should be explored on a case by case basis.
- Use simulated annealing or some other randomized optimization procedure. This gets more and more beneficial as the number of servers and groups goes up.
Measuring Results
How did we evaluate?
Now that we have the whole algorithm for assigning servers to groups, we are ready to perform the test and evaluate the quality of the novel way of doing the sampling. Is the procedure better than simple stratified random sampling? If yes, by how much? Is it worth the effort?
We evaluate this using an A/A test. The two groups have to be almost identical on the historical data as we optimize on it. Informally, when we plot, their lines on the graph have to match almost completely. Moreover, we have to check if they stay similar during an A/A test and for how long. That will give us the information about the level of trust we can have in the group selection algorithm. Ideally, we’d like the groups to stay similar for a very long time. That would mean we have no impediments in A/B testing regarding differing groups.
Results
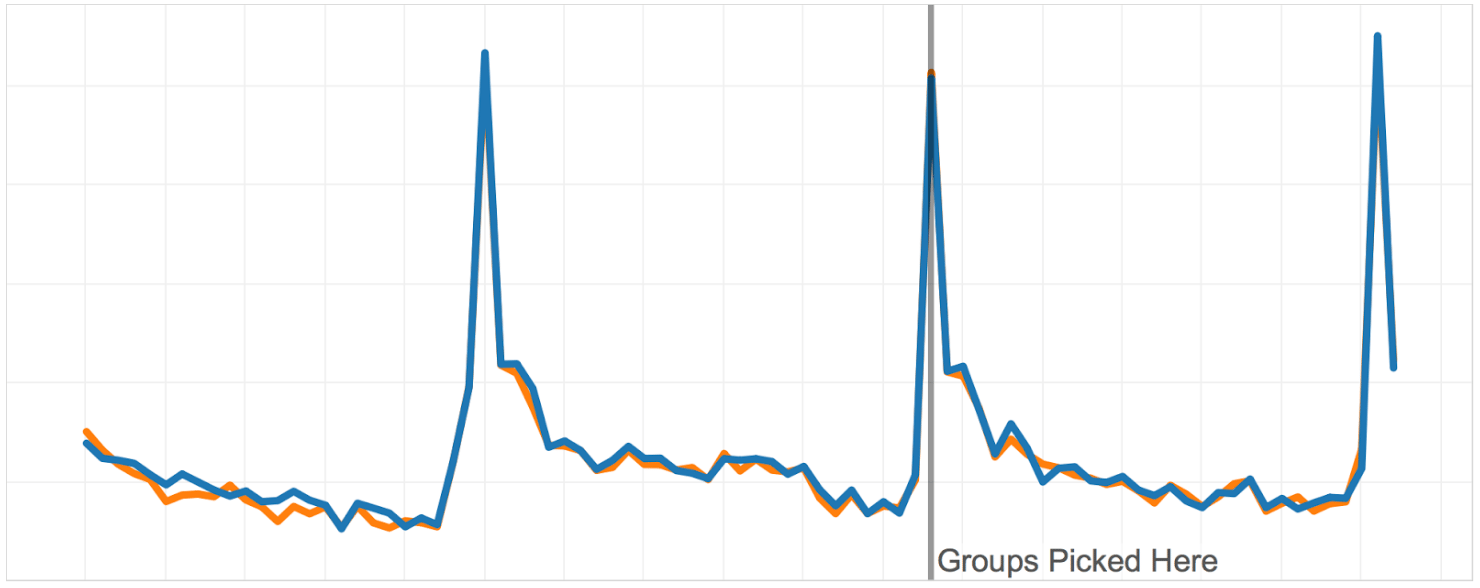
The graphs below show the A/A test performed on two groups optimized on two months of historical data.
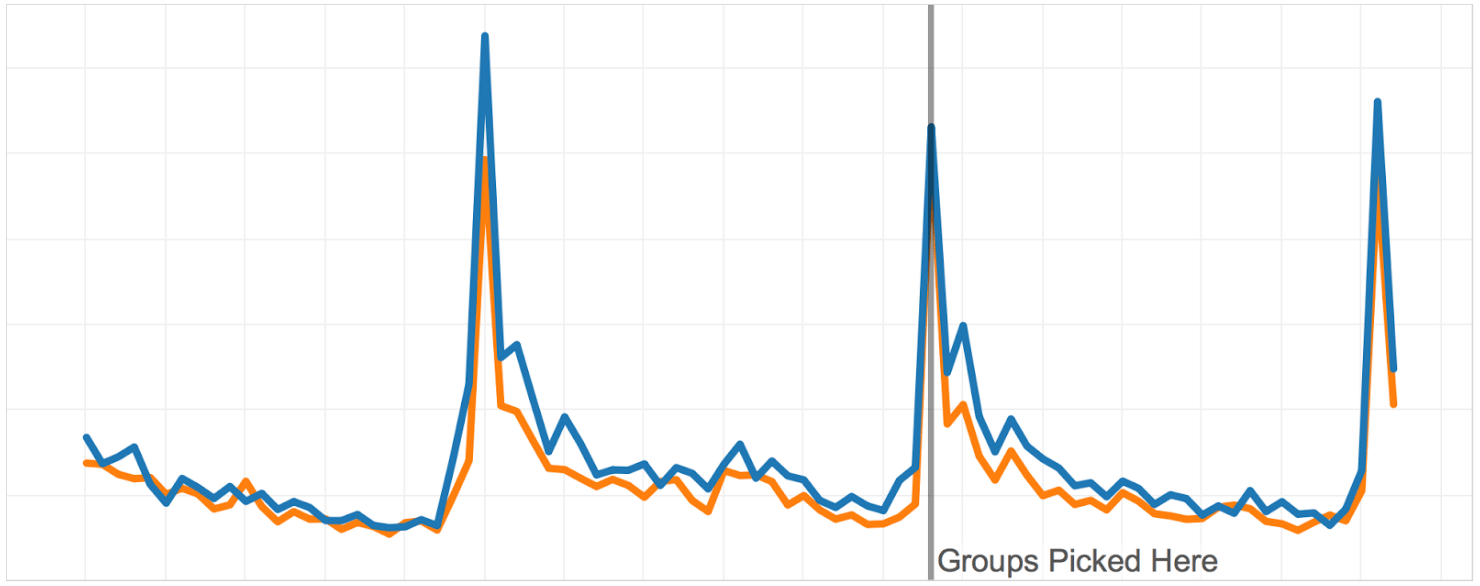
On the following graph, you can see how an A/A test looks like with the stratified random sampling. The variance is more than existent and also the means of groups differ. This impedes the analysis of the A/B test substantially.
On the graph below, you can see the groups obtained with our novel algorithm. You can see how similar the groups are on the historical data we optimized on. That’s to be expected. What’s even more cool is that the groups remain similar for weeks after we picked them. That practically means that if we notice any difference after we launch the test, we can rest assured that the difference is the consequence of the new feature and not statistical noise or a systematic difference that existed prior to the A/B test.
Conclusion
A/B testing is a brilliant tool to objectively solve game design dilemmas and gain some additional playtime or revenue, and ultimately, make your game better.
The demands of A/B testing means that users are exposed to different sets of criteria. However, if your game is an online PVP game, then it is especially important to remain fair. A failure to do that will result in an unequal playing field and your game’s integrity will suffer. If you value your players above anything else, then that integrity is something that should never be compromised.
In this article, I have presented an algorithm to choose test groups in the best possible way, to make the analysis as simple as possible, and to make the results as statistically significant as possible. I hope that you will try it, and that it will improve your A/B testing pipeline in the future.
If you have any additional questions, feel free to leave a comment below.